Part I — Live Index (Real-time Scale & Modulation Lookup)
The Live Index is a fast, streaming lookup engine for scale relationships. It searches millions of precomputed
comparisons from Scale X → Scale Y and returns matches with bridge chords, harmonic degrees,
note lists, and an overall compatibility signal.
What’s in each result
Scale X / Scale Y: full names including tonic, family, and mode/degree.
Bridge chords: candidate chords with tonic, degrees (e.g., 1_3_7_9), and notes.
Match / Probability: a condensed compatibility measure based on weighted intervals.
What you can do with it
Discover smooth modulation paths using shared/bridge chords.
Contrast nearby vs. distant regions (e.g., Major ↔ Melodic Minor).
Chain multiple X→Y hops to sketch short progressions.
Quickstart
Type a term (tonic, family, mode, or chord symbol) in the search box.
Results stream in real time; click a row to expand details.
Save interesting pairs and test them in your composition.
Tips
Start broad (e.g., “Hungarian Major”), then refine by tonic or degree.
Use precise tokens like C Dorian Degree 4 when you know exactly what you want.
Combine with the Heatmap: scan color regions first, then fetch concrete bridge chords here.
Part II — Live Analyzer (Graph-level Exploration)
The Live Analyzer builds an on-the-fly graph of scales and their strongest relationships. It streams items
progressively so you can watch nodes (scales) and edges (high-quality X↔Y links) appear as the scan advances.
How rescans work
Streams NDJSON messages like progress, item, and end (with rare shard_error/fatal).
Reads the same knowledge base as the Live Index but applies sampling, scoring, and targets
to balance breadth and quality.
Stops early when reaching target_nodes and target_edges, or a time/limit budget.
Scoring & filtering (plain English)
Each candidate pair gets a match score from your weighted interval logic and per-entry metrics.
min_match filters weak links; max_deg keeps the graph readable by limiting a node
to its top mutual neighbors.
Typical controls
Target size: target_nodes, target_edges
Quality floor: min_match
Topology: max_deg (mutual degree cap)
Exploration: shuffle + seed
Safety: seconds and limit
What you can do with it
Visualize families and corridors of high compatibility.
Find bridge hubs—scales that connect distant regions.
Prototype multi-hop modulation plans before arranging chords.
Quickstart
Open the Analyzer and start a rescan with default targets.
If the graph is dense, raise min_match or lower max_deg.
Lock interesting nodes/edges and rescan with a different seed to explore alternatives.
Part III — Musical Scales Heatmap (Cell-level Compatibility & Bridge Chords)
The Musical Scales Heatmap is a powerful visualization tool designed to explore the relationships between musical scales. Here's how it works:
The Structure of the Heatmap
The heatmap is a 336x336 grid, representing all combinations of:
12 tonalities (the 12 notes in music: C, C#, D, etc.).
4 main scales: Major, Natural Minor, Harmonic Minor, and Melodic Minor.
7 modes for each scale.
Each cell compares two scales, one from the X-axis and one from the Y-axis, calculating their degree of similarity or dissonance.
Color-Coded Similarity
The color of each cell represents the level of similarity between the two scales:
Dark red: High similarity (shared notes and harmonies).
Dark blue: High dissonance (minimal shared notes).
Lighter shades: Intermediate levels of similarity.
This visual representation allows musicians to quickly identify areas of high compatibility or explore transitions between contrasting scales.
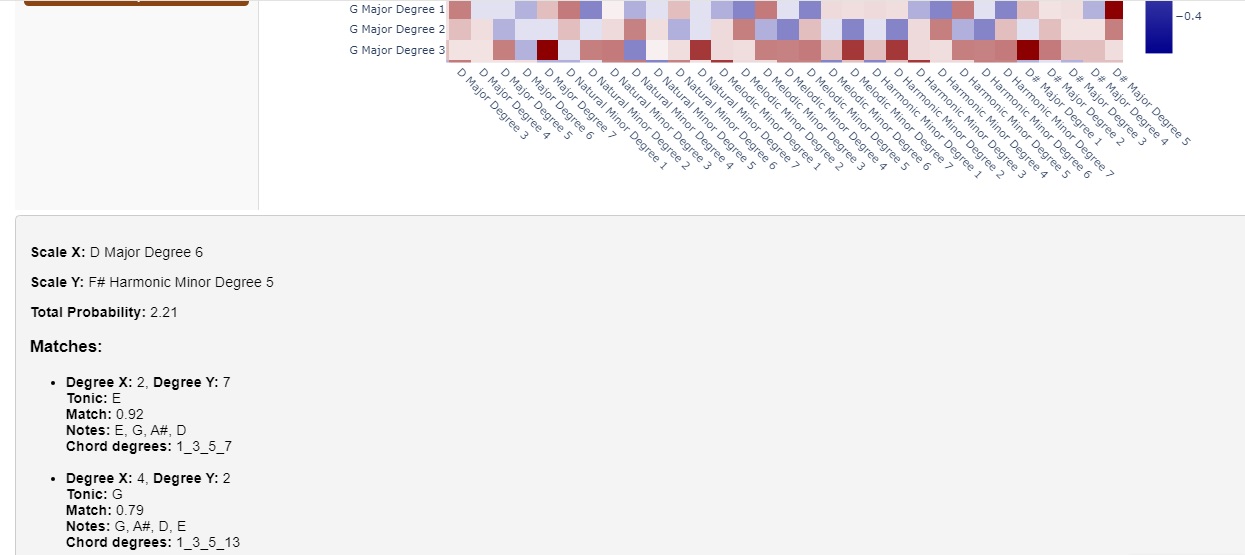
Detailed Information on Click
Clicking on a cell reveals detailed information about the interaction between the two scales:
Scale X: The scale on the X-axis (e.g., "F# Major Degree 2").
Scale Y: The scale on the Y-axis (e.g., "G# Natural Minor Degree 2").
Shared Chords and Notes:
A list of shared chords that can serve as "bridges" for modulation between the scales.
For each shared chord:
Tonic: The root note of the chord.
Coincidence: A value prioritizing harmonically relevant notes (e.g., 3rd or 5th).
Notes: The notes forming the chord (e.g., "F#, A, C#, E").
Chord degrees: Functional roles in a concise format (e.g., "1_3_7_9").
Total Probability: A numeric indicator of the overall compatibility between the two scales.
Navigate Modulations
The heatmap enables you to navigate potential modulations:
Select the tonality, scale, and mode of your current composition on the X-axis.
Find your target tonality, scale, and mode on the Y-axis.
Use the detailed information in the selected cell to:
Identify shared chords for modulation.
Analyze the degree of similarity or contrast between scales.
This feature is especially valuable for composers and improvisers designing smooth or bold transitions between musical ideas.
What You Can Do
Discover Modulation Paths: Use shared chord information for smooth transitions in compositions or improvisations.
Analyze Dissonance and Compatibility: Identify compatible or contrasting scales for a given tonality.
Interactive Exploration: Zoom in to explore specific areas or scroll through broader patterns.
Plan Transitions: Design modulation strategies for your compositions.
🎶 Song Generator
Create unique, reproducible songs with advanced musical harmonization.
For support, contact us at: support@reharmonizationmaps.com